Free Four Column Chart PDF Template
Free Four Column Chart PDF Template
Effective organization and presentation of information can greatly enhance the understanding and absorption of knowledge in both academic and professional settings. A Four-Column Chart serves as an invaluable tool in achieving this goal by providing a structured format for categorizing and detailing information. This form, widely used across various fields for its simplicity and clarity, allows users to easily categorize data under four different headings, making the comparison and analysis of different sets of information straightforward. Whether it is for summarizing research findings, planning projects, or organizing discussion points, the versatility of the Four-Column Chart is evident. By requiring users to write headings for each column and then add relevant details, it fosters critical thinking and helps in the meticulous breakdown of complex subjects. This format, as specified in the file which includes placeholders for the user's name and date to ensure personalization and responsibility for the information presented, is protected under copyright by Houghton Mifflin Company, highlighting its proprietary design and the value attributed to structured informational tools in educational and corporate environments.
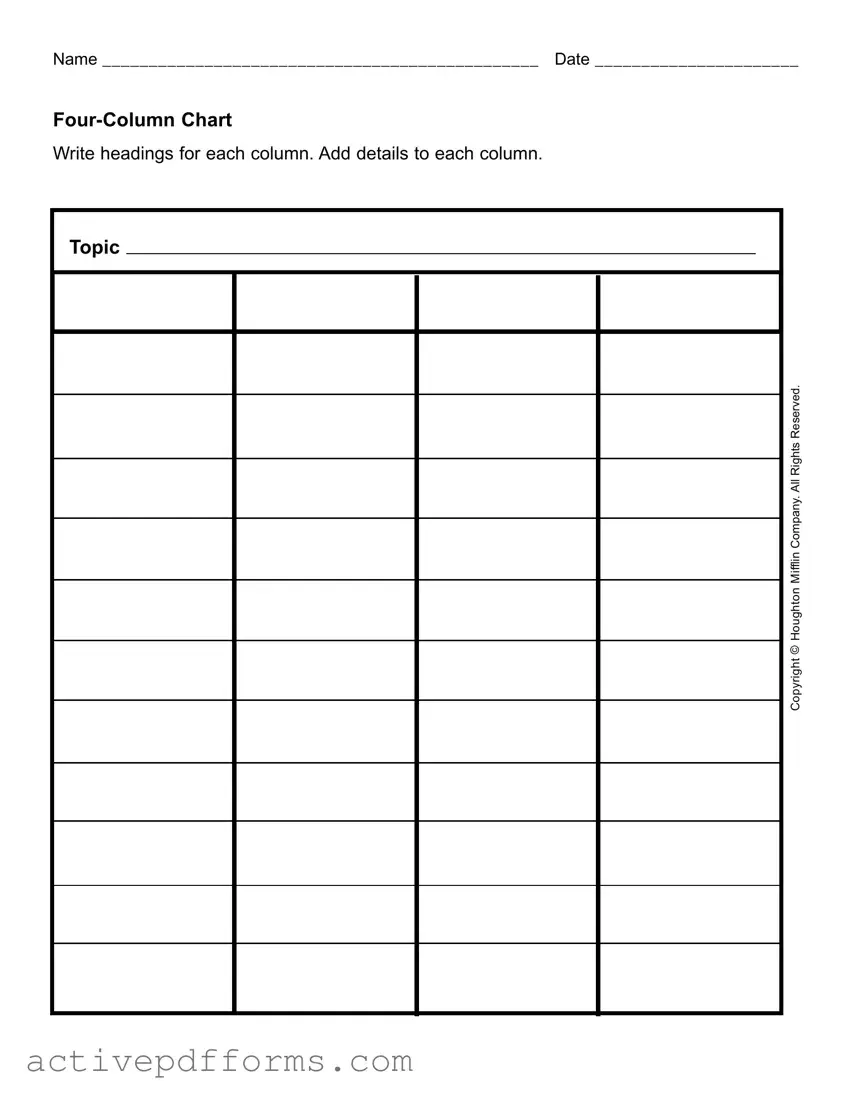
Name _______________________________________________ Date ______________________
Write headings for each column. Add details to each column.
Topic |
Mifflin Company.All Rights Reserved. |
Houghton |
Copyright © |
| Fact Name | Description |
|---|---|
| Form Purpose | The Four-Column Chart form is designed to help individuals organize information or data systematically under four separate headings. This format supports clarity and analysis for topics requiring detailed examination. |
| Content Customization | Users are expected to write their own headings for each column based on their specific needs or topics of interest. This customization feature makes the form versatile for various applications, from academic research to business planning. |
| Legally Protected Content | The form features a copyright notice, indicating that the template and its original content are legally protected under copyright law. This notice typically means that the form cannot be reproduced without permission from Houghton Mifflin Company. |
| General User Information | At the top of the form, spaces are provided for the user to fill in their name and the date. This feature supports record-keeping and personalization of the document for individual use or future reference. |
| Governing Law | For forms like the Four-Column Chart that contain copyrighted content, the governing law would involve federal copyright law in the United States, specifically Title 17 of the U.S. Code. State-specific laws are not generally applicable in copyright concerns, given its federal jurisdiction. |
Once the Four Column Chart form is in your hands, it's time to get started. This form is a versatile tool designed for organizing information into easily digestible columns. Whether it’s for educational purposes, work-related tasks, or personal projects, an effectively filled form can streamline thoughts, compare and contrast data, or plan out details. The key is to approach each column with a clear purpose, ensuring that the information presented is relevant and structured.
After filling out the form, take a moment to review your entries. Each column should present the information in a clear, logical flow that aligns with your objectives. This form is not just a vessel for raw data but a structured way to present information that reveals patterns, connections, or differences. With everything in place, you're set to make the most out of the organized data for your specific needs.
What is a Four Column Chart and why is it used?
A Four Column Chart is a simple organizational tool that helps in displaying information in a structured manner. Each of the four columns has a unique heading under which details are added. This format is particularly useful for categorizing and examining different aspects of a subject or project. It aids in comparative analysis, data organization, tracking progress, or breaking down tasks into smaller, manageable parts. Educational settings, business planning, and personal project management are common areas where this tool finds application.
How does one decide what headings to put on each column?
The headings for each column should be determined based on the objective of the chart. For example, in a project management setting, the headings might be Tasks, Responsibilities, Deadlines, and Status. In an educational context, they could be Date, Topic, Key Facts, and Summary. The purpose of the chart is to bring clarity and order, so headings should be chosen that best divide the information into clear, distinct categories that will contribute to the goal of the chart.
Can this chart be used for group projects or workshops?
Yes, a Four Column Chart is an excellent tool for group projects or workshops. It facilitates collaborative brainstorming and planning by allowing team members to contribute under each category. This helps in ensuring that all aspects of a project or topic are covered, and tasks are clearly assigned. It also serves as a visual representation of the project’s components, making it easier for everyone involved to understand their roles and the project's scope.
Are there digital versions of the Four Column Chart, or is it only available in paper format?
While the concept of a Four Column Chart originates from paper-based planning and organization, digital versions are readily available and widely used. Many project management software and apps have features that allow users to create similar charts. These digital tools offer the added benefits of easy editing, sharing, and integration with other digital planning tools. Users can customize the charts to fit their specific needs, which makes it a flexible option for both individual and collaborative projects.
How does one effectively utilize a Four Column Chart?
To effectively utilize a Four Column Chart, start by clearly defining the purpose and the headings of each column to ensure they align with the objectives. Add details meticulously to each column, ensuring accuracy and relevance of the information. Regular updates are crucial to keep the chart current. For collaborative efforts, share the chart with all participants and encourage regular contributions to maintain a collective understanding of the project or topic. Finally, review the chart periodically to make adjustments as needed and to track progress.
When filling out the Four Column Chart form, people often make a variety of mistakes that can affect the clarity and effectiveness of the information they provide. It's important to avoid these errors to ensure that the form serves its intended purpose efficiently. These mistakes include:
Not providing a clear, concise name at the top of the form. This is crucial for identifying the author of the chart.
Forgetting to add the date, which is important for tracking when the information was compiled or updated.
Leaving the column headings blank or using vague headings. The headings should accurately reflect the content that will be added to each column.
Failing to add sufficient details in the columns, making the chart less informative than it could be.
In addition to these specific errors, people also commonly make the following mistakes:
Not utilizing the entire space provided, which can lead to incomplete information or missed details that could be valuable.
Using inconsistent formatting within the columns, which can cause confusion and make the chart harder to read.
Overloading a single column with too much information, making it difficult to distinguish between different pieces of data.
Ignoring the copyright notice at the bottom, "Copyright © Houghton Mifflin Company. All Rights Reserved." It is essential to acknowledge and adhere to copyright laws.
By paying attention to these common mistakes and taking care to avoid them, individuals can create more effective and useful Four Column Charts. Remembering to fill out all parts of the form clearly and accurately ensures that the chart fulfills its intended function, serving as a valuable organizational or analytical tool. Ensuring clarity in the headings and details of each column will make the chart a more effective tool for communication and analysis.
When organizing information, the Four Column Chart is a valuable tool, often used in various settings including education, business, and personal planning. Alongside this versatile form, several other documents can enhance organization, analysis, and communication. Each plays a unique role in helping users structure their thoughts, plans, or data efficiently.
Each document serves a distinctive purpose but complements the Four Column Chart by providing a framework for detailed planning, implementation, and evaluation. Whether for educational objectives, project management, or strategic planning, incorporating these forms and documents creates a comprehensive approach to achieving goals efficiently and effectively.
A T-chart is similar because it also involves dividing information into categories for comparison or organization. However, the T-chart only has two columns, whereas the Four-Column Chart has four.
A Venn Diagram shares similarities with the Four-Column Chart in organizing information for analysis or comparison. A Venn Diagram uses overlapping circles to show relationships and differences, contrasting with the columnar structure of the Four-Column Chart.
The SWOT Analysis form is akin to the Four-Column Chart as it divides information into four distinct areas: Strengths, Weaknesses, Opportunities, and Threats. This format helps in evaluating a project or business strategy.
A KWL Chart (Know, Want to Know, Learned) also organizes information in a structured way to guide learning or research, typically in three columns, compared to the Four-Column Chart's four sections.
An Outline Form shares a methodical approach to structuring information, similar to the Four-Column Chart. While an Outline Form typically progresses linearly, both formats aim to organize details efficiently.
The Flow Chart offers a step-by-step visualization of a process or series of actions, which parallels the Four-Column Chart's structured breakdown of information, albeit through graphics and arrows rather than columns.
A Table format is closely related to the Four-Column Chart as it also involves organizing information into categories across multiple columns and rows, allowing for detailed comparisons and analyses.
The Four Column Chart form is a tool designed to help individuals organize information efficiently. When filling out this form, it's essential to approach it with clarity and attention to detail. Below are lists of things you should and shouldn't do to ensure the form is filled out correctly and effectively.
Things You Should Do:
Things You Shouldn't Do:
By following these guidelines, users can maximize the effectiveness of the Four Column Chart form, making it a valuable tool for organizing and presenting information clearly and coherently.
When it comes to the Four Column Chart form, several misconceptions often arise. These misunderstandings may impede the effectiveness with which individuals utilize this tool.
Understanding these misconceptions is critical to unlocking the full potential of the Four Column Chart. By clarifying its versatility, ease of use, customizable nature, and ability to include various types of data, individuals can leverage this tool in numerous ways beyond its traditional application.
The Four Column Chart is a simple yet powerful tool for organizing information across various domains, including legal documents, educational settings, and personal planning. Its layout, structured to allow detailed comparisons and analyses, makes it especially useful for individuals looking to clearly articulate and juxtapose multiple facets of a single topic or project. Here are six key takeaways for effectively filling out and using this form:
Clearly Define Column Headings: The success of using a Four Column Chart hinges on the clarity and relevance of the headings for each column. These headings should directly relate to the topic at hand and provide a logical framework for the information you aim to compare or analyze. For instance, in a legal context, headings might include Facts, Laws, Application, and Conclusion.
Detailed Entries: The utility of the chart is maximized when details are thorough and relevant. After establishing your headings, each entry added to the columns should contribute directly to the topic's analysis or comparison. This ensures that the final output is comprehensive and informative.
Consistency Across Columns: For the chart to effectively serve its purpose, maintaining consistency in the type of information provided across columns is crucial. Each column should correspond with its specific heading, and the level of detail should be comparable across the chart. This approach aids in ensuring that the analysis or comparison is balanced and equitable.
Regular Reviews and Updates: A Four Column Chart is often a living document, particularly in dynamic circumstances such as ongoing legal cases or project developments. Regularly reviewing and updating the chart with new information or analyses can provide updated insights and reflect the current state of affairs accurately.
Analytical Application: Beyond merely listing facts or details, the Four Column Chart can be used as an analytical tool. By comparing and contrasting the entries across columns, users can identify patterns, inconsistencies, or gaps in information that may not be immediately apparent, allowing for deeper insights into the topic being explored.
Conclusion and Next Steps: After filling out the chart, it serves as an excellent foundation for drawing conclusions or determining next steps. The organized format of the chart facilitates a clear overview of the collected information, supporting informed decision-making processes, whether for legal strategies, educational purposes, or project planning.
By adhering to these key principles, users can leverage the Four Column Chart as a versatile tool for information organization, comparison, and analysis, enhancing clarity and efficiency in their work or studies.
Express Scripts Prior Authorization - A patient's medical condition and drug history information are critical for the approval process.
Restroom Cleaning Log Template - Our detailed Bathroom Cleaning Log Sheet is the perfect tool for maintaining high hygiene standards in farm restroom facilities.